Lesson 1 - The SPSS Environment
In this lesson, before we begin using SPSS, we’ll talk about its user interface and some of its features.
Table of Contents
Lesson Objectives
- Learn about the basic structure of a data file in SPSS.
- Understand the differences between the data view and the variable view.
- Learn about labels for variables, data, and missing/invalid data.
SPSS Windows
There are many different types of windows in SPSS, such as:
- Data View
- Variable View
- Output Variable
- Pivot Table Editor
- Chart Editor
- Text Output Editor
- Syntax Editor
- and more
We’ll talk about some of these in more depth in this lesson.
Basic Structure of an SPSS Data File
IBM SPSS Statistics files are organized by cases (rows) and variables (columns). Typically, variables represent the responses to each question asked in a survey.
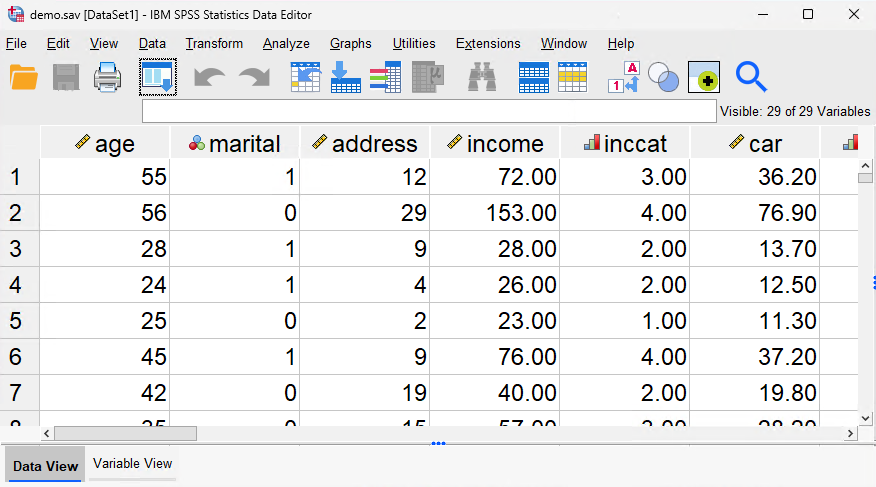
In the image above, you’ll see the data view. Notice that the cases are numbered, whereas the columns have labels. To find a particular respondent’s answers, you can find their case (row). To find everyone’s answer to a particular question, just look at that variable (column).
Some of the variables in this image include one’s age, marital status, address, income, income category, and more. Variables can represent many different types, including numbers, strings, currency, and dates.
Defining Data
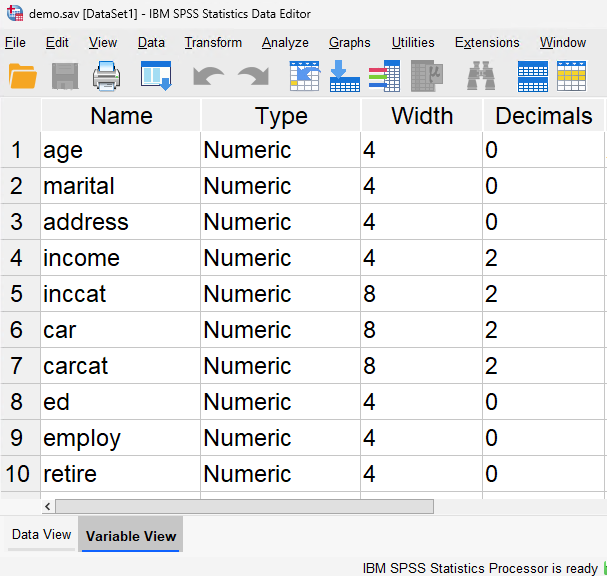
The image above showcases the variable view. Here, you’ll be defining your variable names, types, values, and other details. Variables created here will be shown in the data view as a new column.
Descriptive Labels
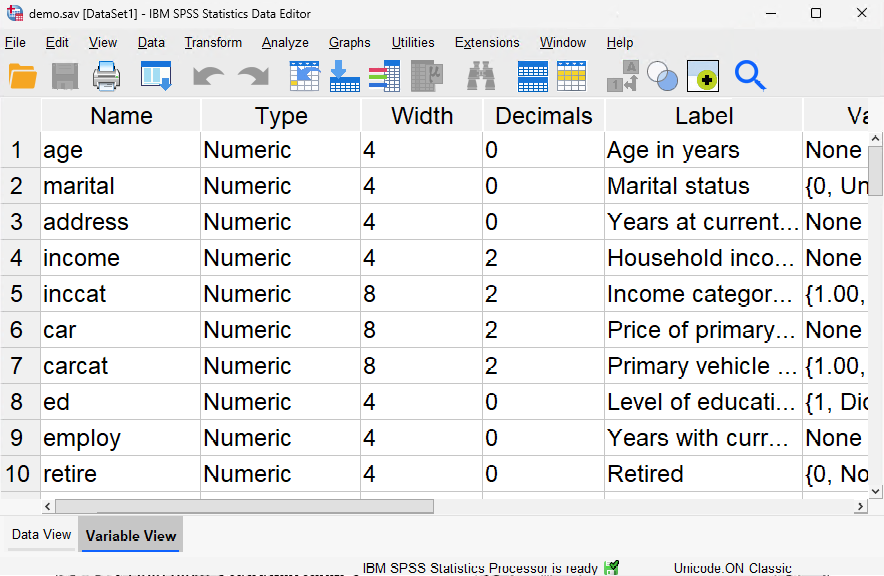
In addition to defining the type of data, you can also define descriptive variable labels and value labels for variable names and data values.
Descriptive labels are longer, more descriptive titles for variables. As you may have noticed, variable names are short and concise. When creating statistical reports and charts, SPSS will use descriptive labels, whereas variable names are mainly used within the data sheet view.
Value Labels
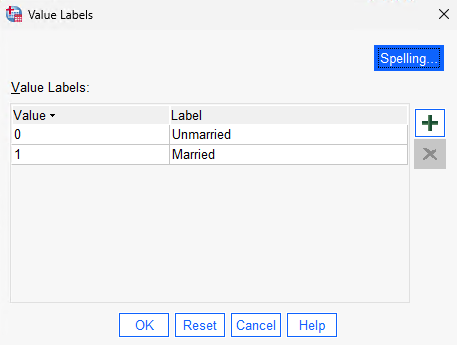
Value labels provide a method for mapping your variable values to string labels. In this example, there are two acceptable values for the marital variable. A value of 0 signifies that the subject is unmarried, whereas a value of 1 signifies that they’re married.
Missing and Invalid Data
Missing and invalid data are too common to ignore. Survey respondents may refuse to answer certain questions, may not know the answer, or may answer in an unexpected format. If you don’t properly filter or identify this data, your analysis may not provide accurate results.
For numeric data, empty data fields or fields containing invalid entries (like letters) are converted to system-missing, identifiable by a single period.
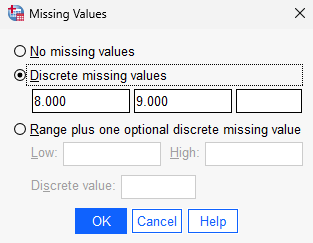
We can use the Missing Values tool to dedicate values for missing and invalid data, which can then be assigned value labels.
Key Points / Summary
- In the data view, you can assign data for each variable in cases.
- In the variable view, you can define the variables in your data.
- SPSS provides a tool to replace missing data, which SPSS takes into account in later data analyses.