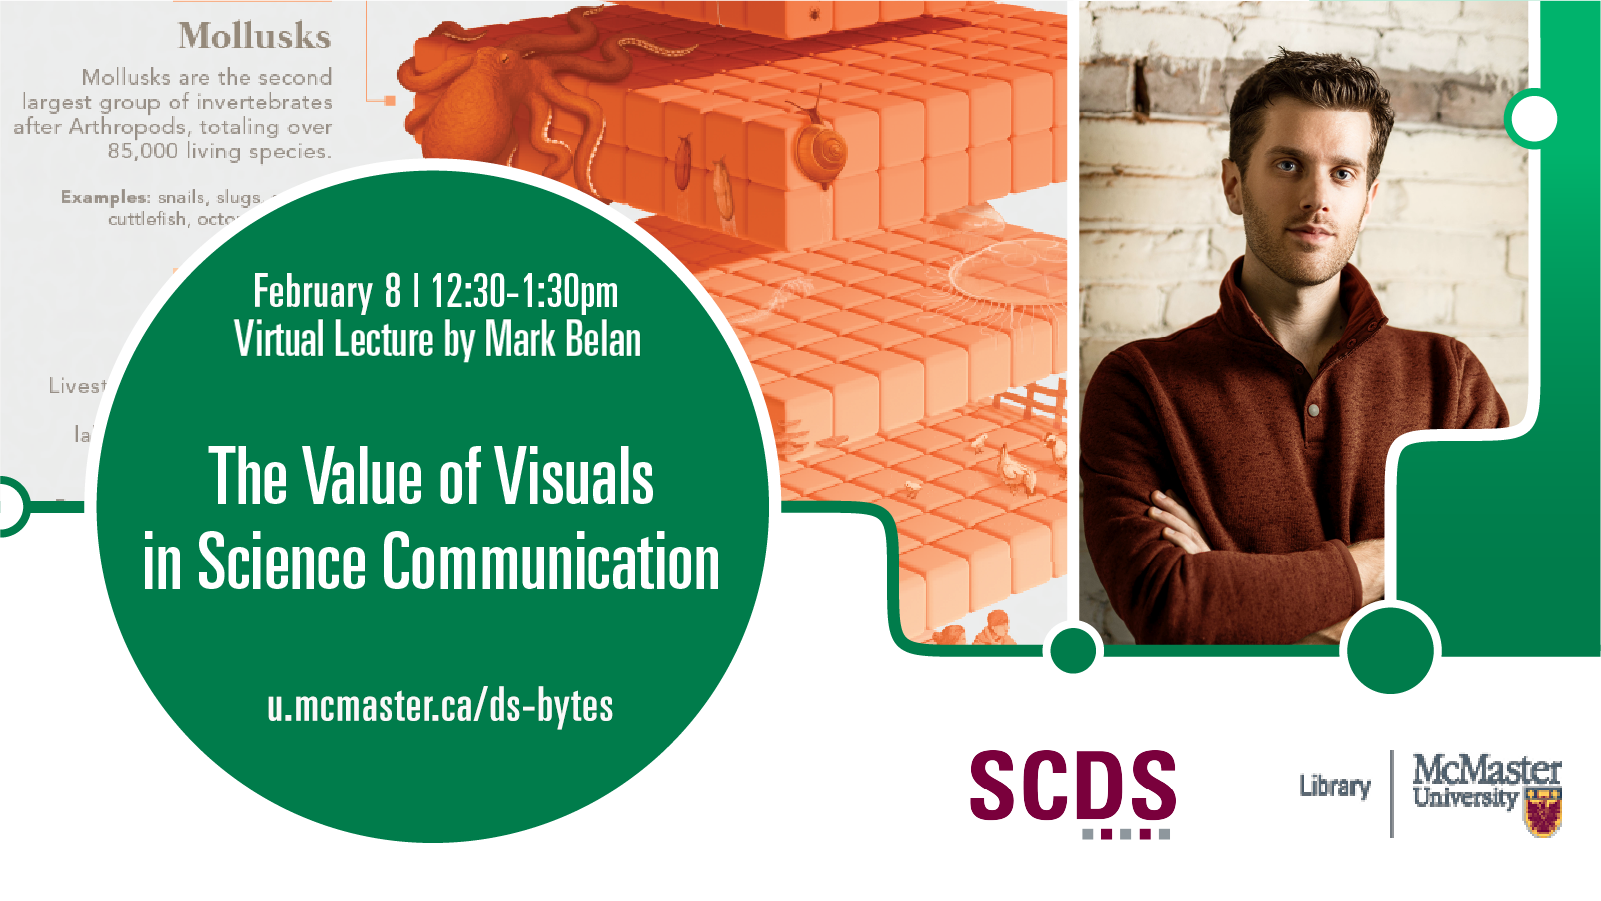
The Value of Visuals in Science Communication
Science research relies on data to describe theories and stories, but communicating the complex, sophisticated, or sometimes esoteric information and relationships within these data is limited. Visual storytelling is becoming increasingly important in a data-driven world: from data visualizations to diagrammatic illustrations, telling science stories requires a visual component. The reasons for this lie in the way we process information.
This virtual talk by Mark Belan (Scientific Graphics Journalist) will introduce the basics of visual perception, its benefit to science communication efforts, and how anyone can manipulate design theory to create visuals (of whatever skill level) to tell impactful, effective, and ultimately better science stories.
Speaker Bio
Mark Belan is a scientific graphics journalist and visual communicator, working at the intersection of art and science to translate scientific concepts into impactful visuals. With two Master of Science degrees (one in Geochemistry/Astrobiology, another in Biomedical Communications), his work and past experience as a researcher has led him to champion the values of visual storytelling when communicating complex and sophisticated ideas, especially in science. Mark is based in Toronto, Canada and yearns to make science more accessible to everyone, with all forms of visual media. Learn more about Mark at
Event Recording
Credits and Attributions
Slide 6 – 8:35 Illustrations © Bryan Christie for Scientific American Volume 306, No. 6 (June 2012) Modified from “Visualizing Science: Illustration and Beyond” and “Building Science Graphics”, Jen Christiansen
Slide 7 – 12:00 Modified from “Visualizing Science: Illustration and Beyond” and “Building Science Graphics”, Jen Christiansen
Slide 8 – 12:27 Modified from “Visualizing Science: Illustration and Beyond” and “Building Science Graphics”, Jen Christiansen Illustrations © Science Graphic Design; © Veronica Falconieri Hays, Falconieri Studios
Slide 13 – 18:41 Drug Targets in the Cell © Nicolle R. Fuller, SayoStudio, sayostudio.com TREM-1/TLR role in immune response (Modified) © Maria Romanova, mariaromanova.rog Influenza Virus and Bacteriophage © Brittanica Online, Meriam-Webster Inc. Animal Cell © CC Adobe Stock Perovskites © Li, Wei, and Li-Jun Ji. “Perovskite Ferroelectrics Go Metal Free.” Science, vol. 361, no. 6398, 12 July 2018, pp. 132–132, https://doi.org/10.1126/science.aat5729. Accessed 19 May 2020. ,
Slide 14 – 19:32 Sun diagram © NASA/Jenny Mottar, Mysteries of the Sun Icemelt © National Geographic Art Dwarf Planets © Mark Belan, artscistudios.com Crevasse © Nature Communications Changing Spots Map © National Geographic Society
Slide 15 – 19:50 Nuclear Fission © Leo Delauncey, Mail Online Snowflake Formation © Megan Dinner, QMI Agency, The Calgary Sun, 2013 Big Bang Theory © unknown Light Wave © The University of Waikato Te Whare Wānanga o Waikato Bubble Formation © Chandler, David. “Controlling Bubble Formation on Electrodes.” MIT News | Massachusetts Institute of Technology, 26 Apr. 2021, news.mit.edu/2021/controlling-bubble-electrodes-0326.
Slide 16 – 20:10 Radiocarbon Yardstick of Time © National Geographic Infographics Aging © Nesta Certification Celestial Orbits © unknown
Slide 17 – 20:43 Sauropod Anatomy © Dino Pulera Earth Oven © Kathryn Killackey Dinosaurs © National Geographic Society Geological Time Spiral © Joseph Graham, William Newman, John Stacy, 2008 Tree of Life © Haeckel
Slide 18 – 21:20 Colonizing Mars © National Geographic Magazine Mars magnetosphere © Ruth Bamford, 2021 Saturn in Earth’s Sky © Yeti Dynamics World Population Meatball © Redditor Kiwi2703, 2021
Slide 19 – 22:00 Neurology anatomy, Plate 68 © Royal College of Physicians, 1853 plate Foot pressure © Tekscan Comparative Embryology © Haeckel Kodak Duaflex III © Tarja K. Kuronen Surface Map © Zoey Mercado Anatomy of a Baseball © NBC SportsEDGE
Slide 23 – 25:10 Comparing How COVID-19 Vaccines and Antiviral Pills Work © Mark Belan, artscistudios.com Second illustration © Mechanism of Action of Small-Molecule Agents in Ongoing Clinical Trials for SARS-CoV-2: A Review. Zhao, Lei et al. 2022 Feb 25
Slide 31 – 29:30 Gun Deaths in Florida © Florida Department of Law Enforcement How Baby Boomers Describe Themselves © unknown
Slide 32 – 31:10 Population Growth from 2000 to 2010 © Claus Wilke
Slide 33 – 31:30 Deaths Per Day © Kirsten McClure
Slide 34 – 32:20 Credits unknown.
Slide 41 – 38:40 Whaling © National Geographic Society The Brain in Slumber © National Geographic Society Aridification © unknown
Slide 44 – 43:10 How Do Nerves Send Signals? © Veronica Falconieri Hays, Falconieri Studios
Slide 45 – 44:30 © Fabio Crameri
Slide 49 – 48:00 A churning, burning star © Chris Bickel, Science Magazine
Slide 51 – 49:40 Figures taken from Aiora Zabala “Designing more effective scientific figures (II)”
Slide 52 – 50:10 Figures taken from Aiora Zabala “Designing more effective scientific figures (II)”
Slide 54 – 52:50 Space, left to right © NASA and Planetary Institute Space, right to left © CC Shutterstock Space, bottom to top © unknown
Slide 55 – 53:30 Biomass of Life, left © Javier Zarracina, VOX Biomass of Life, right© Mark Belan, artscistudios.com
Slide 57 – 55:10 Defects in COG-Mediated Golgi Trafficking Alter Endo-Lysosomal System in Human Cells. Zinia D’Souza, Jessica Bailey Blackburn, Tetyana Kudlyk, Irina D. Pokrovskaya and Vladimir V. Lupashin, Front. Cell Dev. Biol., 03 July 2019
Slide 61 – 59:10 Bovine Cheese Milk-Making © Marmota Art Sizing up the Crab Invaders © Réne Campbell Wild Zebra Finches © Caterina Funghi Lizard Poster © Nicholas Wu