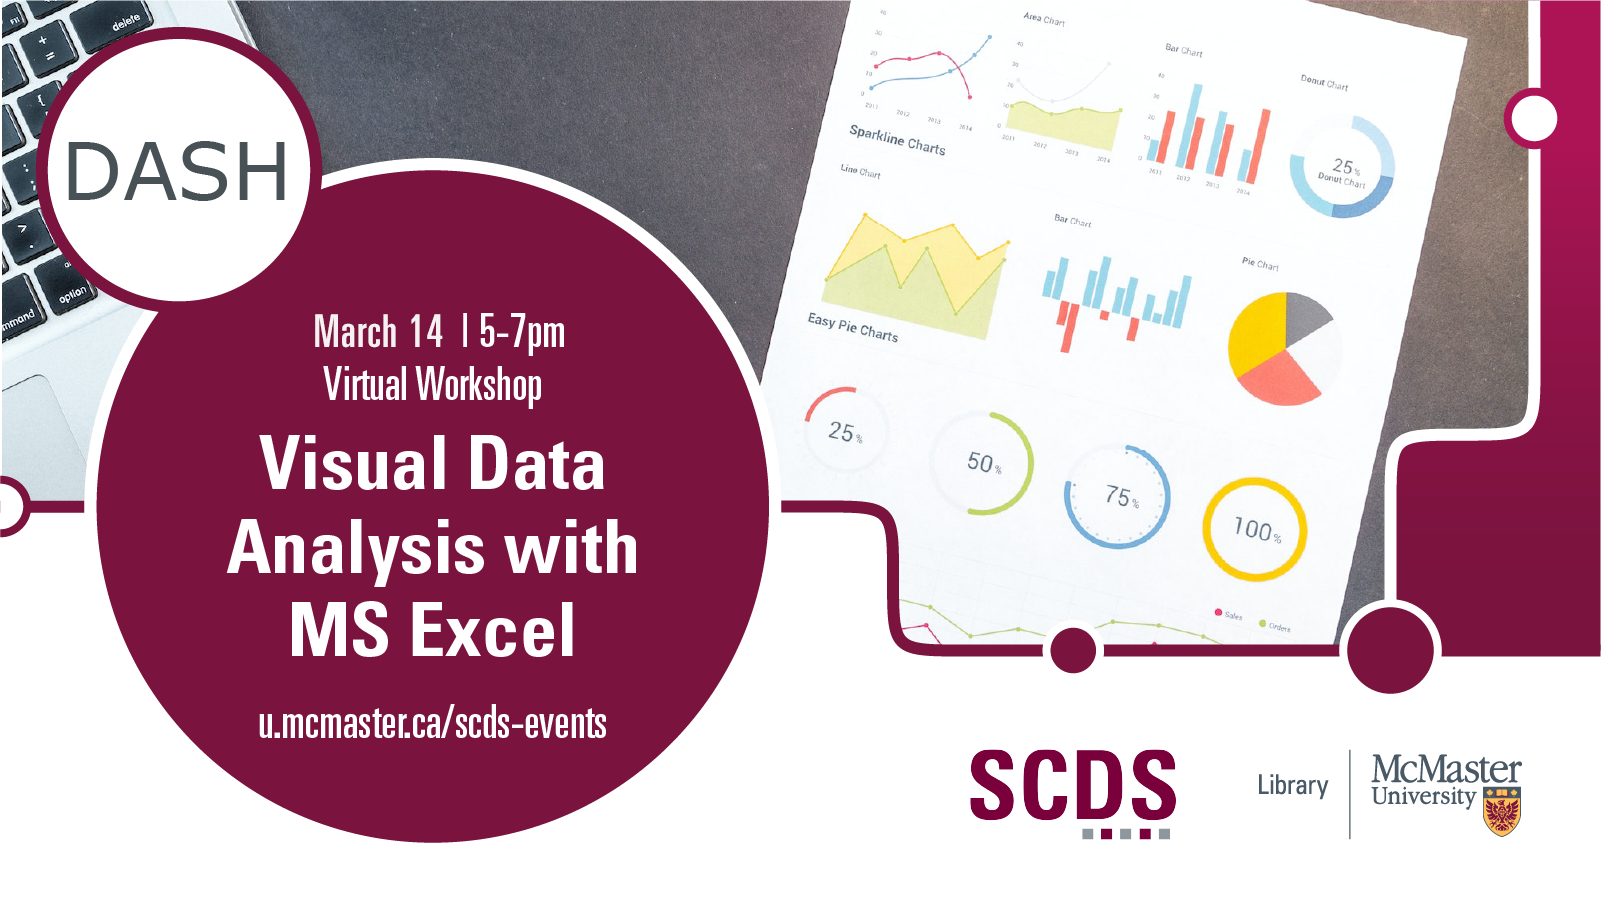
Visual Data Analysis with Microsoft Excel
Data visualization is the graphical representation of information and data. This workshop will cover topics such as applications of data analysis basics for visualizations; effective designs of basic charts such as pie charts, bar charts, and scatterplots; time series analysis and visualization; and more advanced analytical displays like bar-in-bar, slope charts, dot plots, and bullet charts.
A basic working knowledge of MS Excel is required for this workshop.
Presentation by Shaila Jamal, DASH Support Assistant and PhD Candidate in Earth, Environment, and Society.
Book an appointment with Shaila or another member of the DASH Team.
Workshop Preparation
Preparation for this tutorial consists of two steps: Getting the data and Getting the software. Follow the steps below.
Get the data
Access the files mentioned in the workshop.
Get the software
This hands-on workshop uses Excel, a software application for data analysis. The program is included with McMaster tuition and a free version is linked in the previous sentence.